Every Superforecaster® Analytics chart has the same elements, conveying crucial information at a glance.
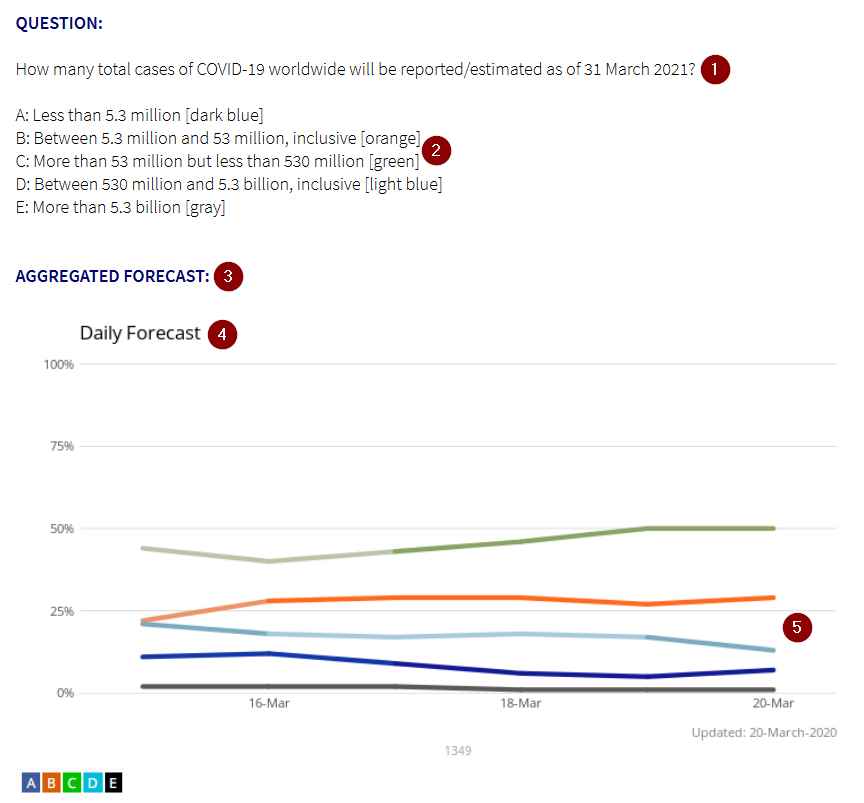
The QUESTION is the task at hand, framed as a testable proposition about an uncertain future event.
The BINS are the possible answers to the question. Carefully defined bins will encompass every possible outcome of the question, without gaps or overlaps. For a forecast, every individual Superforecaster will provide a probabilistic estimate for each outcome. For a complete forecast, the answers provided for the bins will add up to 100%. While Supers may go all-in on one bin, they usually spread their 100% of probability across several bins.
AGGREGATION is the process of combining the probabilities provided by all Superforecasters for each bin.
DAILY FORECASTS are the aggregations that are calculated at the end of each day. Superforecasters update their forecasts on a regular basis, respond to changing information they read in the news and other sources, and engage in direct dialog with each other on the dedicated forecasting platform maintained by Good Judgment.
The PLOT graphs the daily forecasts over time, to help visualize trends as they take shape. Plots are updated daily automatically, while reports are updated on a regular basis.
Intrigued?
Stop guessing. Start Superforecasting.
Schedule a consultation to learn how our FutureFirst monitoring tool, custom Superforecasts, and training services can help your organization make better decisions.
Keep up with Superforecasting news. Discover training opportunities. Make better decisions. Sign up for Good Judgment’s newsletter.