Mechanical engineer and Superforecaster® Kjirste Morrell is featured as an exemplar of outstanding thought processes in best-selling author and top Wharton professor Adam Grant’s latest book, Think Again. Below, she shares insights into her data-driven process for reviewing questions and determining her forecast.

Let me use the question on the number of Federal firearms background checks in April through June 2021. This question is based on a specific set of data that is influenced by many potential factors. The topic evokes a strong emotional response which can bring biases into the forecast. Focus on the data first and make sure you’re looking at the right data.
As with most questions that are about a number from a specific site, the very first step is to go to that site and look at the historical data. Get the correct data into a spreadsheet, using whatever method works best for you. Start making plots, such as the number of monthly background checks by year and over time, to see if there is a seasonal trend and to see if there is a general trend.
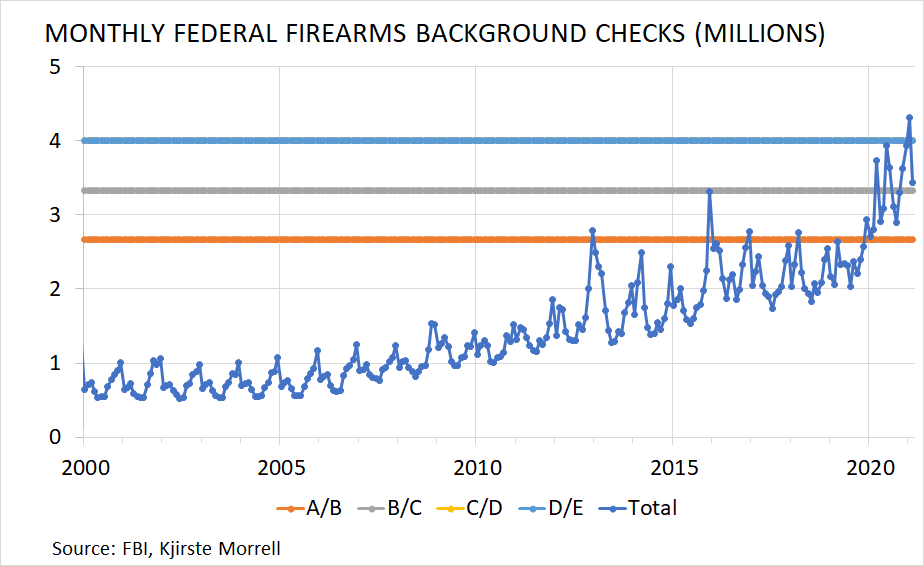
Even looking at the table of numbers, a few things are obvious, so there might be a temptation to skip plotting. I think plotting is worthwhile here, and the two plots I’ve attached emphasize different aspects for this particular set of data. A few of the things that I might wonder about with any data collected over several years are whether there is a seasonal trend or if a general trend is apparent. In this case, there are some seasonal effects: there’s a peak in December, with a secondary peak in March, usually. The number of background checks also rises over time with increasing variability, finishing with 2020 and early 2021’s much higher and more variable numbers.
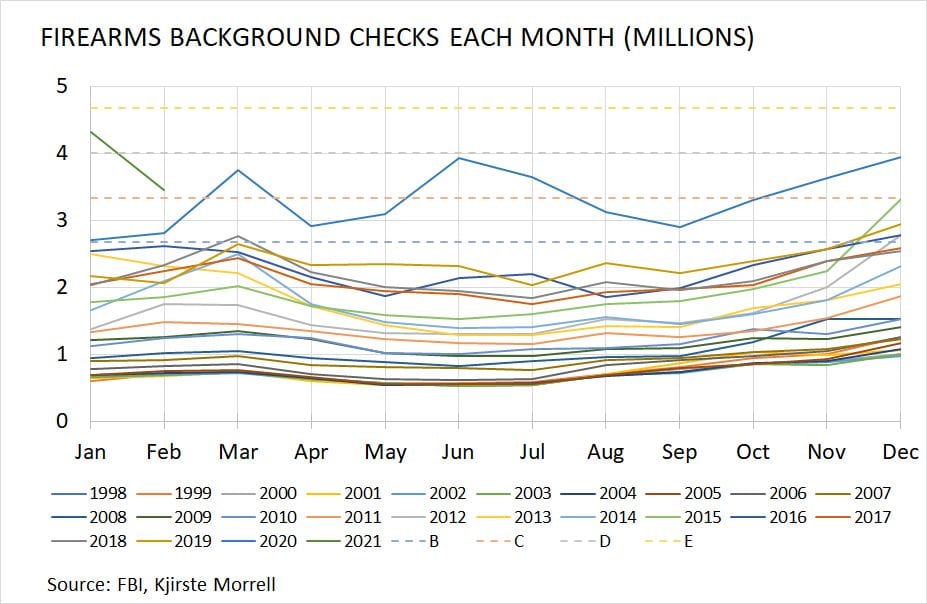
The first question I have is what monthly averages correspond to each bin in the question and how those compare to historical data. Lines at those averages have been added to the figures. In January there were 4.3 M checks, which is the largest monthly amount so far. February was dramatically lower. Similarly, the average of 2.67 M is below any month in the last year. I can imagine events that lead to the total for April-June being either fewer than 8 M or more than 14 M, but some bins may be less likely than others.
Going forward, each month I would check the data at the FBI site and add in a new data point. Consider questions like: Does April rule out another bin or indicate a trend? What are the new monthly averages that would need to be met to end up in each bin?
Once I have a reasonable sense of what the historical data looks like, I like to make a list of factors that could impact the number in question. A few that occur to me here are:
Understanding what the data represents is especially worthwhile, and there is more information at the FBI site about the background check system. (Starting here: https://www.fbi.gov/services/cjis/nics.) Some of the other reports and statistics may be useful, perhaps something there is a leading indicator, more fine-grained data, or suggests another way of looking at the information.
That’s the process I would go through. Probably I would only get partway on the first pass and then add more when revisiting the question later.
Summary:
How would you forecast this question on Good Judgment Open?
Schedule a consultation to learn how our FutureFirst monitoring tool, custom Superforecasts, and training services can help your organization make better decisions.