Human vs AI Forecasts: What Leaders Need to Know
 In October 2025, our colleagues at the Forecasting Research Institute released new ForecastBench results comparing large language models (LLMs) and human forecasters on real-world questions. Superforecasters still lead with a difficulty-adjusted Brier score of 0.081, while the best LLM to date, GPT-4.5, scores 0.101.
In other words, Superforecasters have a roughly 20% edge over the best model (lower scores are better).
Meanwhile, LLMs have surpassed the median public forecaster and continue to improve. FRI notes that a simple linear extrapolation would suggest LLM-Superforecaster parity by November 2026.
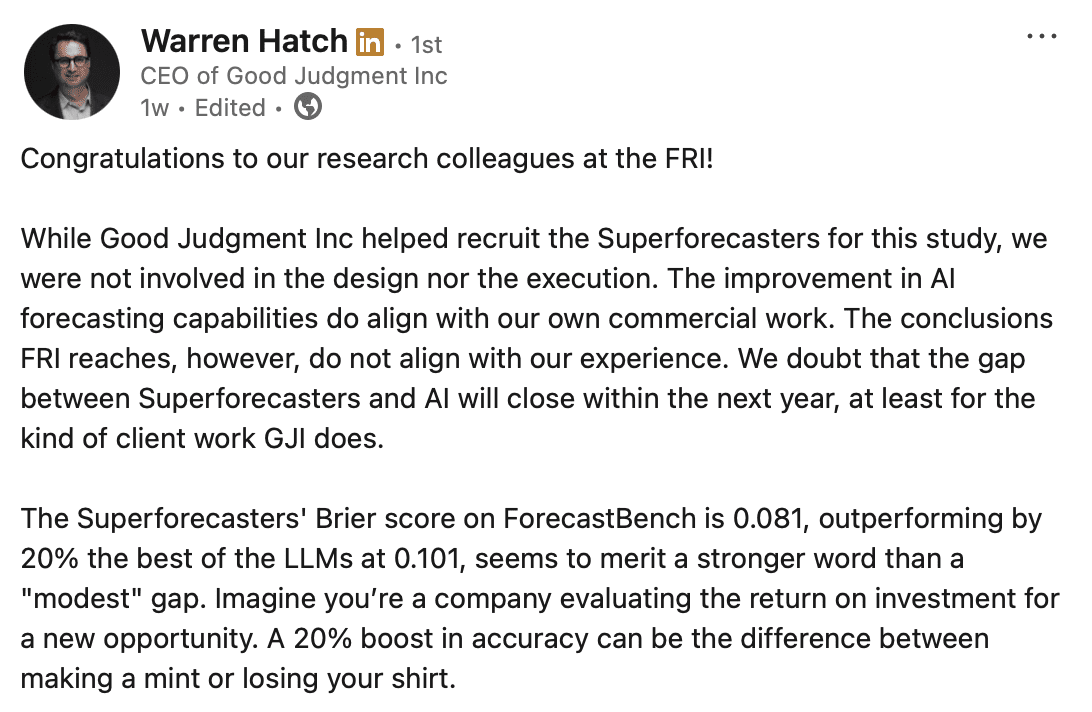
While Good Judgment Inc helped recruit Superforecasters for this study, we were not involved in its design or execution.
Good Judgment’s Take
We track AI benchmark results closely. Our client work points to a slower timeline than that suggested by the FRI. For the kinds of problems leaders bring to us, we doubt the Superforecaster-AI gap will close within the next year, or, for questions with limited or fuzzy data—which tends to be the case with most high-impact real-world questions—even in the next several years, if ever. The reasons for our take are threefold.
First, ForecastBench tested binary (yes/no) questions. In our client work, more than two thirds of questions are multinomial or continuous. Leaders often need a probability distribution and point estimates, not just a yes/no threshold. Asking whether US GDP, for instance, will exceed 3% next year is less informative than estimating the full distribution so organisations can plan for a range of outcomes.
Second, as the original GJP research has shown, teaming and aggregation raise accuracy by 10% to 25%. Structured teaming and advanced aggregation (beyond simple medians) reduce noise, ensure a broader spectrum of viewpoints and data points, and improve calibration, especially on complex questions that require subjective judgment. The factors of teaming, advanced aggregation, and question types merit further study, in our judgment.
Third, the AI research tournaments typically collect forecasts at a single point in time. However, new information is always coming in, which makes updated forecasts more accurate and more useful for decision makers.
It is also important to note that a 0.081 vs 0.101 result translates roughly to a 20% edge in accuracy. For decision makers, a 20% improvement can change both the choice and the outcome.
What This Means for Decision Makers
For organisations that need timely, reliable, high-stakes decisions, this is the key takeaway: AI progress is real, but disciplined human judgment still sets the bar. For the best results today, our view is human + AI. Use Superforecasters and Superforecasting methods with capable, secure models for faster, better forecasts.
What our clients value are not only the numbers but also the rationales that Superforecasters provide with their numerical forecasts. By examining their chain of reasoning—something that black-box systems cannot provide reliably—leaders are able to scrutinize assumptions, trace causal links, and stress-test scenarios by noting hidden risks. This transparency makes the decision process more deliberate, accountable after fact, and explainable to stakeholders.
As CEO Dr. Warren Hatch noted in a recent Guardian interview, “We expect AI will excel in certain categories of questions, like monthly inflation rates. For categories with sparse data that require more judgment, humans retain the edge. The main point for us is that the answer is not human or AI, but human and AI to get the best forecast possible as quickly as possible.”
Learn more about FutureFirst and see ahead of the crowd.