Open-Minded Forecasting in a Deeply Polarized World

Open-Minded Forecasting in a Deeply Polarized World

Americans today are more polarized than ever, and their split along two ideological extremes complicates a forecaster’s job. Polarization stresses feelings over facts, confounding the separation of signal from noise that’s essential to forecasting accuracy. Also, the forecaster’s own biases and preferences can be harder to recognize—and set aside—when society at large is polarized and the outcomes are personally consequential.

When Good Judgment Inc, a forecasting company with an unrivalled track record of accuracy, asked its professional Superforecasters to predict the outcome of the 2020 US election cycle, these challenges were front and center. Many Superforecasters live in the United States and feel deeply about political issues in the country. Some of them worried this could cloud their forecasting judgment. But Superforecasters thrive in the face of challenges. Here is what they did, and what you can do to improve the accuracy of your own predictions in a polarized world.

US Election 2020: Getting It Right

On the question of the presidency, the Superforecasters ­predicted a Democratic win of the White House in March 2020 and never looked back. On control of Congress, they began predicting both the House and Senate would go to the Democrats as early as June. Furthermore, they accurately called:

    • the long-delayed concession,
    • the record voter turnout, and
    • the Democrats’ presidential fundraising edge as of 30 September.

But getting it right is only half of the picture. Good Judgment strives not only to be right but also to be right for the right reasons. When polarization abounds, this is all the more important. To calibrate their thinking, Superforecasters use three simple strategies that consistently result in more accurate predictions.

Consider Alternatives

While the Superforecasters as a group assigned high odds for a Democratic sweep, individual Superforecasters predicted a variety of outcomes. A diversity of views is essential for good forecasting, but on issues you hold dear, considering other views is easier said than done. Over the week before the election, Good Judgment asked the Superforecasters as a group to imagine they could time-travel to a future in which the Republicans retained both the White House and the Senate. Regardless of their individual forecasts, they were then asked to explain why a “Blue Wave” election failed to occur in such a future.

This is called a pre-mortem, or “what if,” exercise. Thinking through alternative scenarios ahead of the actual outcome accomplishes several goals. It forces the forecaster to consider other perspectives, to rethink the reasoning and evidence supporting their forecasts. It also tests the forecaster’s level of confidence (over-confidence being a far more common issue than under-confidence) and helps avoid hindsight bias when evaluating the forecasts later.

Because Superforecasters already weigh multiple alternatives in making forecasts, this pre-mortem produced little change in the overall forecasts. Even after several days of internal debate on the “what if” scenarios, their aggregate probabilities barely moved.

But the exercise was useful. It showed that the Superforecasters’ predictions were well calibrated. It also produced multiple scenarios with detailed commentary, some of which proved clear-eyed in light of the actual events following the election.

Kjirste Morrell, one of Good Judgment’s leading Superforecasters, was among the participants in the exercise. She says she didn’t make large changes to her forecasts but underscores the value of the discussion.

“In retrospect, I should have placed more credence on the possibility of violence after the election, which was mentioned during the pre-mortem exercise,” she says.

Keep It Civil

A wise crowd encompasses diverse views. Studies based on the Good Judgment Project (GJP) found that being an “actively open-minded thinker” is positively correlated with being an accurate forecaster. That’s no mystery. Exposure to views with which we disagree can inform our understanding of the world. But Superforecasters don’t simply agree with everything. They know how to “disagree without being disagreeable.”

All forecasters can master this trait, as witnessed on our public forecasting platform, GJ Open. Throughout the 2020 election cycle, moderators observed very few comments that fell outside the reasonable bounds of civil discourse. This relative civility on GJ Open may surprise those accustomed to the rough-and-tumble of the Twitterverse. But it comes as no shock to Good Judgment’s co-founder Barb Mellers, whose research suggests that forecasting tournaments can reduce political polarization.

As the election cycle intensified and the public debate grew more heated and personal elsewhere on social media, GJ Open continued to emphasize facts and reasoned argument. It showed that forecasters can learn to remain focused on what matters to the accuracy of their predictions and block out the noise of inflammatory rhetoric.

Keep Score

Keeping score is essential to good forecasting, says Good Judgment’s co-founder Philip E. Tetlock. Superforecasters are not the only professionals who recognize this. Weather forecasters, bridge players, and internal auditors all know that tracking prediction outcomes and getting timely feedback are strategies that improve­­ forecasting performance. Superforecasters use quantifiable probabilities to express their forecasts and Brier scores to measure accuracy. Keeping score enables forecasters and companies to learn from past mistakes and to calibrate their forecasts in the future.

No single forecast is truly right or wrong unless it is expressed in terms of absolute certainty (0% or 100%). If the probability of President Trump being re-elected were 13% (Good Judgment’s forecast as of 1 November), he would win the election 13 out of 100 times if we could re-run history repeatedly. That’s why forecasting accuracy is best judged over large numbers of questions.

The Superforecasters’ accuracy has been scrutinized over hundreds and hundreds of questions, and a forecasting method that can beat them consistently has yet to be found. The Superforecasters know what they know—and what they don’t know. They know how to think through alternative scenarios and how to “disagree without being disagreeable.” They also know the importance of keeping score. When it comes to calculating the odds for even highly polarized topics, their process shows how best practices deliver the best accuracy.

* This article originally appeared in Luckbox Magazine and is shared with their permission.

How to Combat Overconfidence—One Superforecaster’s Take

How to Combat Overconfidence—One Superforecaster’s Take

Military historian and Superforecaster® Jean-Pierre Beugoms is featured as an exemplar of outstanding thought processes in best-selling author and top Wharton professor Adam Grant’s latest book, Think Again. Below, he shares insights on overconfidence and how it can be avoided by judging the evidence properly.

Jean-Pierre Beugoms

A high-confidence forecast can be fully justified when the evidence supporting it is strong. When the evidence supporting such a forecast is weak, then we can say the forecaster is being overconfident. We can therefore avoid overconfidence by properly judging whether the evidence is strong or weak.

I have found that people often fall into the trap of making overconfident forecasts when they let their gut or intuition do the forecasting for them and when they dismiss or overlook critical information that contradicts their forecast rationales.

A textbook example of overconfidence might be Peter Funt’s March 29, 2021, column in USA Today entitled, “There’s zero chance Joe Biden will run in 2024.” A zero-probability forecast for a Biden reelection campaign may well be an accurate one, but the evidence he uses in support of his forecast is underwhelming.

First, Funt bases his forecast on out-of-date information. He points to Ryan Lizza’s campaign reporting which cites four people who say a reelection campaign is “inconceivable” to Biden, but he ignores the more recent reporting of The Hill, which notes that those close to Biden assume he will run again.

Second, Funt interprets Biden’s declaration that he sees his presidency as a bridge to the next generation of leaders in only one way. That is, as a promise to serve one term. Biden’s statement is ambiguous, however. There is no reason why his bridge cannot encompass two terms.

Third, Funt dismisses Biden’s response to a reporter’s question asking him whether he will run again. Although Biden answered in the affirmative, Funt argues that Biden has no choice but to say yes because, if he says otherwise, he will immediately become a lame-duck president. The argument certainly makes sense, but is it not possible that Biden also means it?

Fourth, Funt completely neglects the “outside view.” He fails to look at what other ambitious people in high office have done. Had he done so, he would have realized that Biden’s decision to pass on a chance at winning reelection would be a highly unusual move even given his advanced age.

In short, had Funt considered the reporting that contradicted his assumptions, he may well have tempered his forecast. On the other hand, an article entitled “There’s a forty-five percent chance Biden will run in 2024” will not receive as many clicks.

The best way to guard against overconfidence in forecasting is to embrace uncertainty. Most people just want to know whether a fact is true or not and whether an event is going to happen or not. Denied this certainty, they will throw up their hands and declare the future as completely unknowable. This kind of thinking will get you into trouble because reality is often not quite as clear-cut.

You will have to get used to thinking in terms of probabilities of truth instead of yes (100%), no (0%), or who knows (50%). When confronted by a person who thinks in black-and-white terms, do not be afraid to say things like, “yes, but it depends,” or “what you say is true, but I am not as categorical as you are,” or “you are wrong, but not completely wrong.”

As part of your forecast rationale, include a list of uncertainties or possible secondary events that would have an effect on your forecast. Whittle down or expand the list as needed. Try this out and you will be well on your way toward being a well-calibrated forecaster.

Look at your forecasts with fresh eyes from time to time. Play the devil’s advocate and challenge the assumptions that undergird your high-confidence forecast. This exercise will help you weigh more objectively those annoying little facts that call your forecast into question.

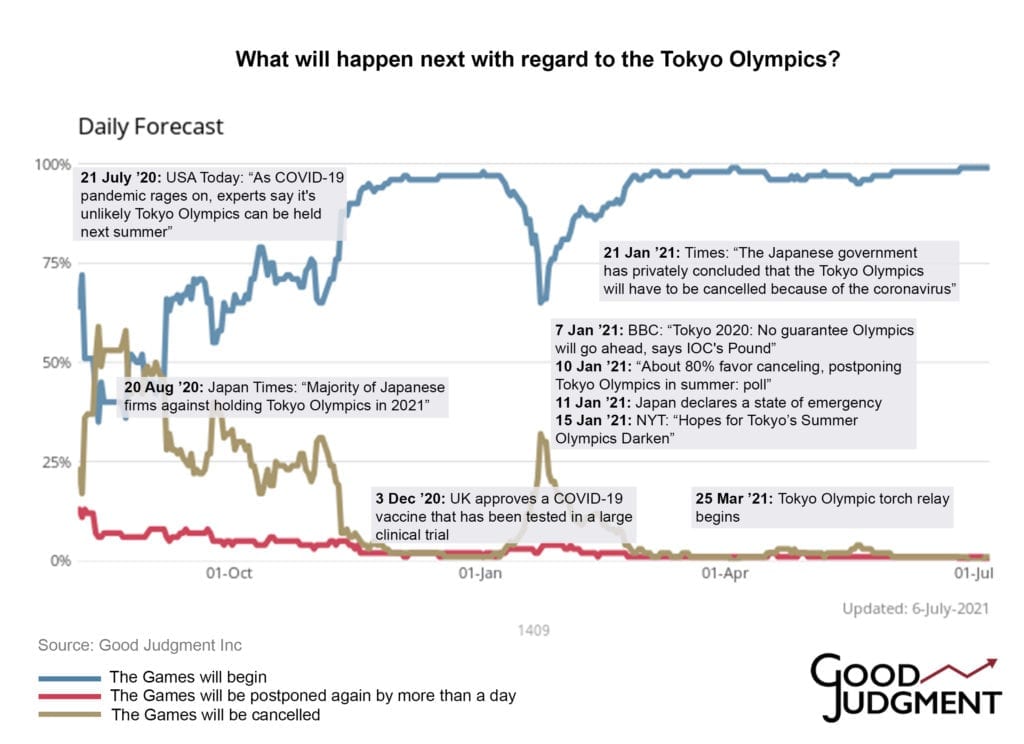
Here are some facts that may undermine the high-confidence consensus forecast that the Tokyo Olympics and/or Paralympics will go as planned. While it is true that Tokyo is no longer under a state of emergency, the chances of a renewed surge in cases are not negligible, especially since a good many Japanese would not have received their vaccines by the time the games begin. A clear majority of the Japanese public oppose going ahead with the games, owing to these public health concerns. How would the government of Japan react to a public outcry over another wave of cases? While it is true that the political and economic incentives to hold the games are great, are we to believe that this hypothetical event would have no effect on their decision-making?

I am not arguing that anyone should moderate their near-certain yes forecast (e.g., 95%) to a more tentative yes forecast (e.g., 65%). I am saying that going through this exercise of questioning your own forecast, even if it does not result in you changing your forecast at all, will at least give you greater assurance that your high-confidence forecast is a sound one.

Learn to think like a Superforecaster with our Online Training course!
The three short modules provide a solid foundation for novice forecasters in fields such as finance, strategy, and consulting.

A Closer Look at a Superforecaster’s Scientific, Data-based Method

A Closer Look at a Superforecaster’s
Scientific, Data-based Method

Mechanical engineer and Superforecaster® Kjirste Morrell is featured as an exemplar of outstanding thought processes in best-selling author and top Wharton professor Adam Grant’s latest book, Think Again. Below, she shares insights into her data-driven process for reviewing questions and determining her forecast.

Kjirste Morrell is one of the most accurate Superforecasters

Let me use the question on the number of Federal firearms background checks in April through June 2021. This question is based on a specific set of data that is influenced by many potential factors. The topic evokes a strong emotional response which can bring biases into the forecast. Focus on the data first and make sure you’re looking at the right data.

As with most questions that are about a number from a specific site, the very first step is to go to that site and look at the historical data. Get the correct data into a spreadsheet, using whatever method works best for you. Start making plots, such as the number of monthly background checks by year and over time, to see if there is a seasonal trend and to see if there is a general trend.

Even looking at the table of numbers, a few things are obvious, so there might be a temptation to skip plotting. I think plotting is worthwhile here, and the two plots I’ve attached emphasize different aspects for this particular set of data.  A few of the things that I might wonder about with any data collected over several years are whether there is a seasonal trend or if a general trend is apparent. In this case, there are some seasonal effects: there’s a peak in December, with a secondary peak in March, usually. The number of background checks also rises over time with increasing variability, finishing with 2020 and early 2021’s much higher and more variable numbers.

The first question I have is what monthly averages correspond to each bin in the question and how those compare to historical data. Lines at those averages have been added to the figures. In January there were 4.3 M checks, which is the largest monthly amount so far. February was dramatically lower. Similarly, the average of 2.67 M is below any month in the last year. I can imagine events that lead to the total for April-June being either fewer than 8 M or more than 14 M, but some bins may be less likely than others.

Going forward, each month I would check the data at the FBI site and add in a new data point. Consider questions like: Does April rule out another bin or indicate a trend? What are the new monthly averages that would need to be met to end up in each bin?

Once I have a reasonable sense of what the historical data looks like, I like to make a list of factors that could impact the number in question. A few that occur to me here are:

  • Are any new laws going into effect that will require more background checks?
  • Is reported violence rising or falling?
  • Does it seem like fear of future violence/unrest is rising or falling?
  • Has gun control legislation been discussed recently in news outlets?
  • Could supply affect this number?
  • Are there other limiting factors, like max throughput or number of people?
  • What is behind the seasonal peaks, especially March—are there sales events that explain that?
  • Do I understand where the number of background checks comes from?

Understanding what the data represents is especially worthwhile, and there is more information at the FBI site about the background check system. (Starting here: https://www.fbi.gov/services/cjis/nics.) Some of the other reports and statistics may be useful, perhaps something there is a leading indicator, more fine-grained data, or suggests another way of looking at the information.

That’s the process I would go through. Probably I would only get partway on the first pass and then add more when revisiting the question later.

Summary:

  • Go to the FBI link. The most important thing is to know what the data looks like for the source that will be used to settle the question.
  • Download the FBI data and put it into a spreadsheet.
  • Graph yearly and over time
  • Break the bin boundaries into average per month and plot with the data
    • 8 M is an average of 2.67 M/month,
    • 10 M is an average of 3.33 M/month,
    • 12 M is an average of 4 M/month,
    • 14 M is an average of 4.67 M/month
  • How reasonable is it that any of these averages will be met in April-June 2021?
  • As data is added for April & May, does that rule out any bins?
  • Make a list of factors that might affect the data and investigate those.

How would you forecast this question on Good Judgment Open?

Learn to think like a Superforecaster with our Online Training course!
The three short modules provide a solid foundation for novice forecasters in fields such as finance, strategy, and consulting.